One-state genes
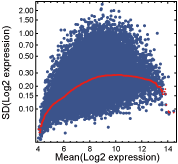
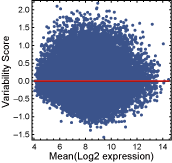
One-state genes are expressed unimodally across the CNS regions, and approximately followed a log-normal distribution. Some one-state genes exhibited stable expression patterns, characterized by the log-normal distribution with a small variance, whereas others had more variable expression and showed the log-normal with a larger variance. By using a "variability score" determined from the expression data, "stable" and "variable" one-state genes in the adult mouse CNS were identified. Before assigning variability scores to the probesets with unimodal expressions, probesets that were not "present" in any CNS region were filtered out. A probeset was regarded as "present" in a CNS region when both samples for the region were called "present" by the Affymetrix MAS5 detection algorithm (Statistical Algorithms Description Document, Affymetrix). Next, a scatter plot of the mean (Y-axis) and standard deviation (X-axis) of the log2-transformed expression values for each of the "present" probesets was made, and a curve showing the running median of the standard deviation was drawn (Figure 1). Variability scores were calculated by dividing the standard deviation by its running median, and then applying log2-transformation (Figure 2).

Figure 1

Figure 2