BrainStars: 1460453_at: Tagap1
| Affymetrix Probe set ID | 1460453_at |
|---|---|
| Gene Name | T cell activation GTPase activating protein 1 T cell activation Rho GTPase activating protein |
| Gene Symbol | Tagap1 AA415005 FKSG15 Tagap 2610315E15Rik |
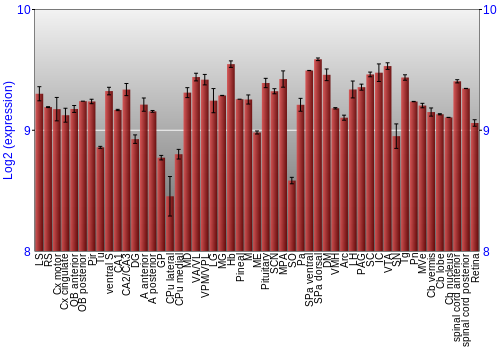
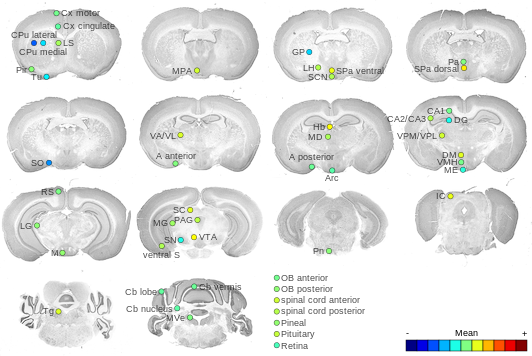
BrainStars Expression at 51 brain regions
PDF files:
Expression Graph,
Expression Map
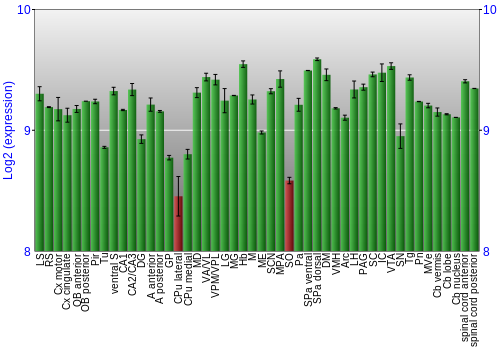
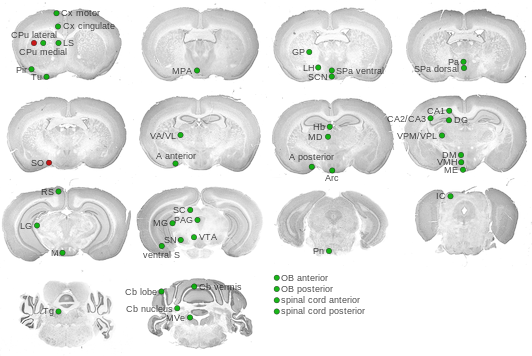
BrainStars classification of 48 brain regions by multi-state gene analysis
| # States | 2 |
|---|---|
| Score | -16.4170544792928 |
PDF files:
Expression Graph,
Expression Map
Other brain expression resources
Cross section images
The ABA expression energy cross section images were obtained from the Allen Mouse Brain Atlas, Allen Instiute for Brain Science © 2008. Please refer to their original terms of use.
Links to other resources
BrainStars 1-D expression files
You can download BrainStars expression data in a table.| TSV format file | BrainStars expression in a tab-separated values format |
| CSV format file | BrainStars expression in a camma-separated values format |
BrainStars 3-D expression files
You can download this entry's BrainStars expression data putting on 3-D mouse brain models.| VCAT format file | BrainStars expression putting on a brain model. The file can be viewed with a software, VCAT, downloadable from VCAD@RIKEN site. |
| XPR format file | BrainStars expression putting on a Allen Reference Atlas brain model. You can view the XPR file with the Brain Explorer software provided by the Allen Institute. |
External links
| Entrez GeneID | 380608 72536 |
|---|---|
| MGI ID | MGI:3615484 3615484 |
| Ensembl | ENSMUSG00000033450 ENSMUSG00000079571 |
| UniGene ID | Mm.371734 |
| RefSeq Transcript | NM_145968 NM_147155 |
| RefSeq Protein | NP_666080 NP_671511 |
| Allen Brain Atlas | Tagap |
| EMAGE | Tagap |