How to view each probe set entry
Annotation
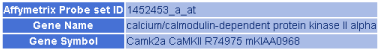
Figure 1. Annotation.
Expression
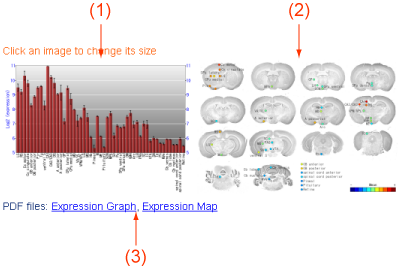
Figure 2. Expression.
The expression values of the probe set can be shown in this view. (1) A barchart showing expression values of all CNS regions. (2) Expressoin values are shown as colors on an image of brain slices. Sizes of these two images (1, 2) can be switched (half and full sizes) by clicking the images. (3) These images in the PDF format can be downloaded here. You can use and modify these images by your own purposes.
Classification
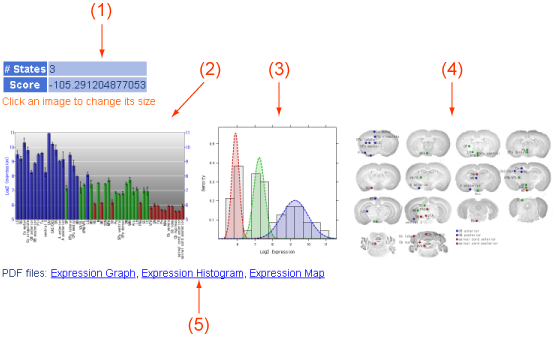
Figure 3. Classification.
CNS regions were classified by their states in multi-state gene analysis for each probe set. The view shows states of CNS regions. (1) The number of states and the score in the multi-state gene analysis for the probe set. (2) A barchart showing states in distinct colors. (3) A histogram of expression values and predicted distributions of all state. (4) States indicated by colors are put on an image of brain slices. Sizes of these images (2-4) can be switched by clicking the images. (5) These images in the PDF format can be downloaded here. You can use and modify these images by your own purposes.
Data download
You can download BrainStars expression data for the probe set in various formats. (1) Table files. You can download a table of the expression data in TSV or CSV formats. (2) 3-D files. You can download expression data on 3-D mouse brain models in VCAT and XPR formats. VCAT file can be shown with the RIKEN Voxcel Editor (RVEditor) software that is available at the RVEditor site. XPR file can be shown the Brain Explorer software that is available at the Allen Institute site.
Reference to external databases
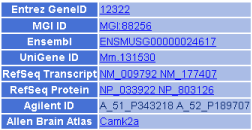
Figure 4. List of references to external databases.
References to corresponding external entries in the other public databases (Entrez Gene in NCBI, MGI in the Jackson Laboratory, Ensembl in EBI, UniGene in NCBI, RefSeq in NCBI, Agilent probes and Allen Brain Atlas in the Allen Institute) are shown.
Go to the documents page