Supplemental Data
GeneChip data
The GeneChip data is also available at NCBI GEO (GSE16496).
- RMA expression table in MS-Excel xls format (zipped XLS format, 49 Mbytes)
- RMA expression table in tab-delimited text format (zipped tab-delimited text format, 30 Mbyte)
Analyzed data
- Sample information for all 51 CNS regions.
- The file contains two sheets, one for CNS regions and the other for sample information. The information for CNS regions provides the region ID, region symbol, region name, region abbreviation, anatomical classification, and note for each region. The information for samples includes the sample ID, region ID, region symbol, number of sampled mice for each time point, and sample dates for each experimental replicate. (MS Excel; 41KB)
- List of gene categories.
- This file contains 13 sheets, one each for genes encoding transcription factors (TF), channels, G protein-coupled receptors (GPCRs), cell-adhesion proteins, structural proteins, extracellular matrix proteins, neurogenesis proteins, homeobox proteins, nuclear receptors, neurohormone/neurotransmitter ligand and receptor proteins, solute carrier (SLC) transporters, and forkhead proteins. (MS Excel; 3,319)
- List of neurotransmitter/neurohormones.
- This file contains 3 sheets, one for ligand-receptor pairs and the others for ligands and receptors. The information for ligand-receptor pairs provides the compound, ligand genes, ligand probe set IDs, receptor genes, receptor probe set IDs, compound type. The information for ligands/receptors provides the probe set ID, Gene ID, compound, gene symbol, gene name, and compound type.
- List of marker gene candidates.
- The file contains two sheets, one for high-expression-level and the other for low-expression-level marker gene candidates. Both sheets give the probe set ID, fold change, and the expressed region for each marker gene candidate. (MS Excel; 253KB)
- Multi-state genes.
- This file lists the probeset ID, group number of each brain region, and mean, standard deviation, and weight of each group, gene name and gene symbol for each multi-state probeset. (MS Excel; 7,811KB)
- Multi-state genes in terms of their gene categories.
- The file contains 11 sheets: one each for genes encoding nuclear receptors, forkhead proteins, transcription factors (TF), solute carrier (SLC) transporters, channels, G protein-coupled receptors (GPCRs), homeobox proteins, cell adhesion proteins, structural proteins, extracellular matrix proteins, and neurogenesis proteins. All sheets list the probeset ID, "up"-state regions, and its annotation for each probeset. (MS Excel; 960KB)
- Types of gene categories for those genes repeatedly selected as having an "up" state in pairs of region
- The file contains three sheets: one each for the gene ontology (GO) terms for the biological process, the molecular function, and the cellular component class. All sheets list the region pair, GO ID, P-value, FDR, and GO term. (MS Excel; 3,851KB)
- Gene variability scores.
- The file lists the probeset ID, mean, standard deviation (SD), number of presence calls, variability score, gene name, and gene symbol for each probeset. (MS Excel; 3,735KB)
- Regions with up-regulated levels of ligand and receptor genes encoding neurohormones and neurotransmitters.
- The list provides the neurohormone/neurotransmitter name, probeset ID, Entrez GeneID, gene symbols, and "on"- and "up"-state regions for each ligand/receptor pair. (MS Excel; 119KB)
- Putative "intrinsic" connections inferred from multi-state genes encoding ligands and receptors for neurohormones (NH) and neurotransmitters (NT).
- (A-B) The list of pairs of ligand and receptor genes that had at least one common "on"-state (A) or "up"-state (B) CNS region. Both lists give the name of the neurohormone or neurotransmitter, probe set ID, Entrez GeneID, gene symbols for the ligand and receptor genes, Pearson's correlation between the ligand and receptor gene expressions, and the number ("# of matched states") and names of common "on"- or "up"- state regions for each ligand/receptor pair. (MS Excel; 105KB)
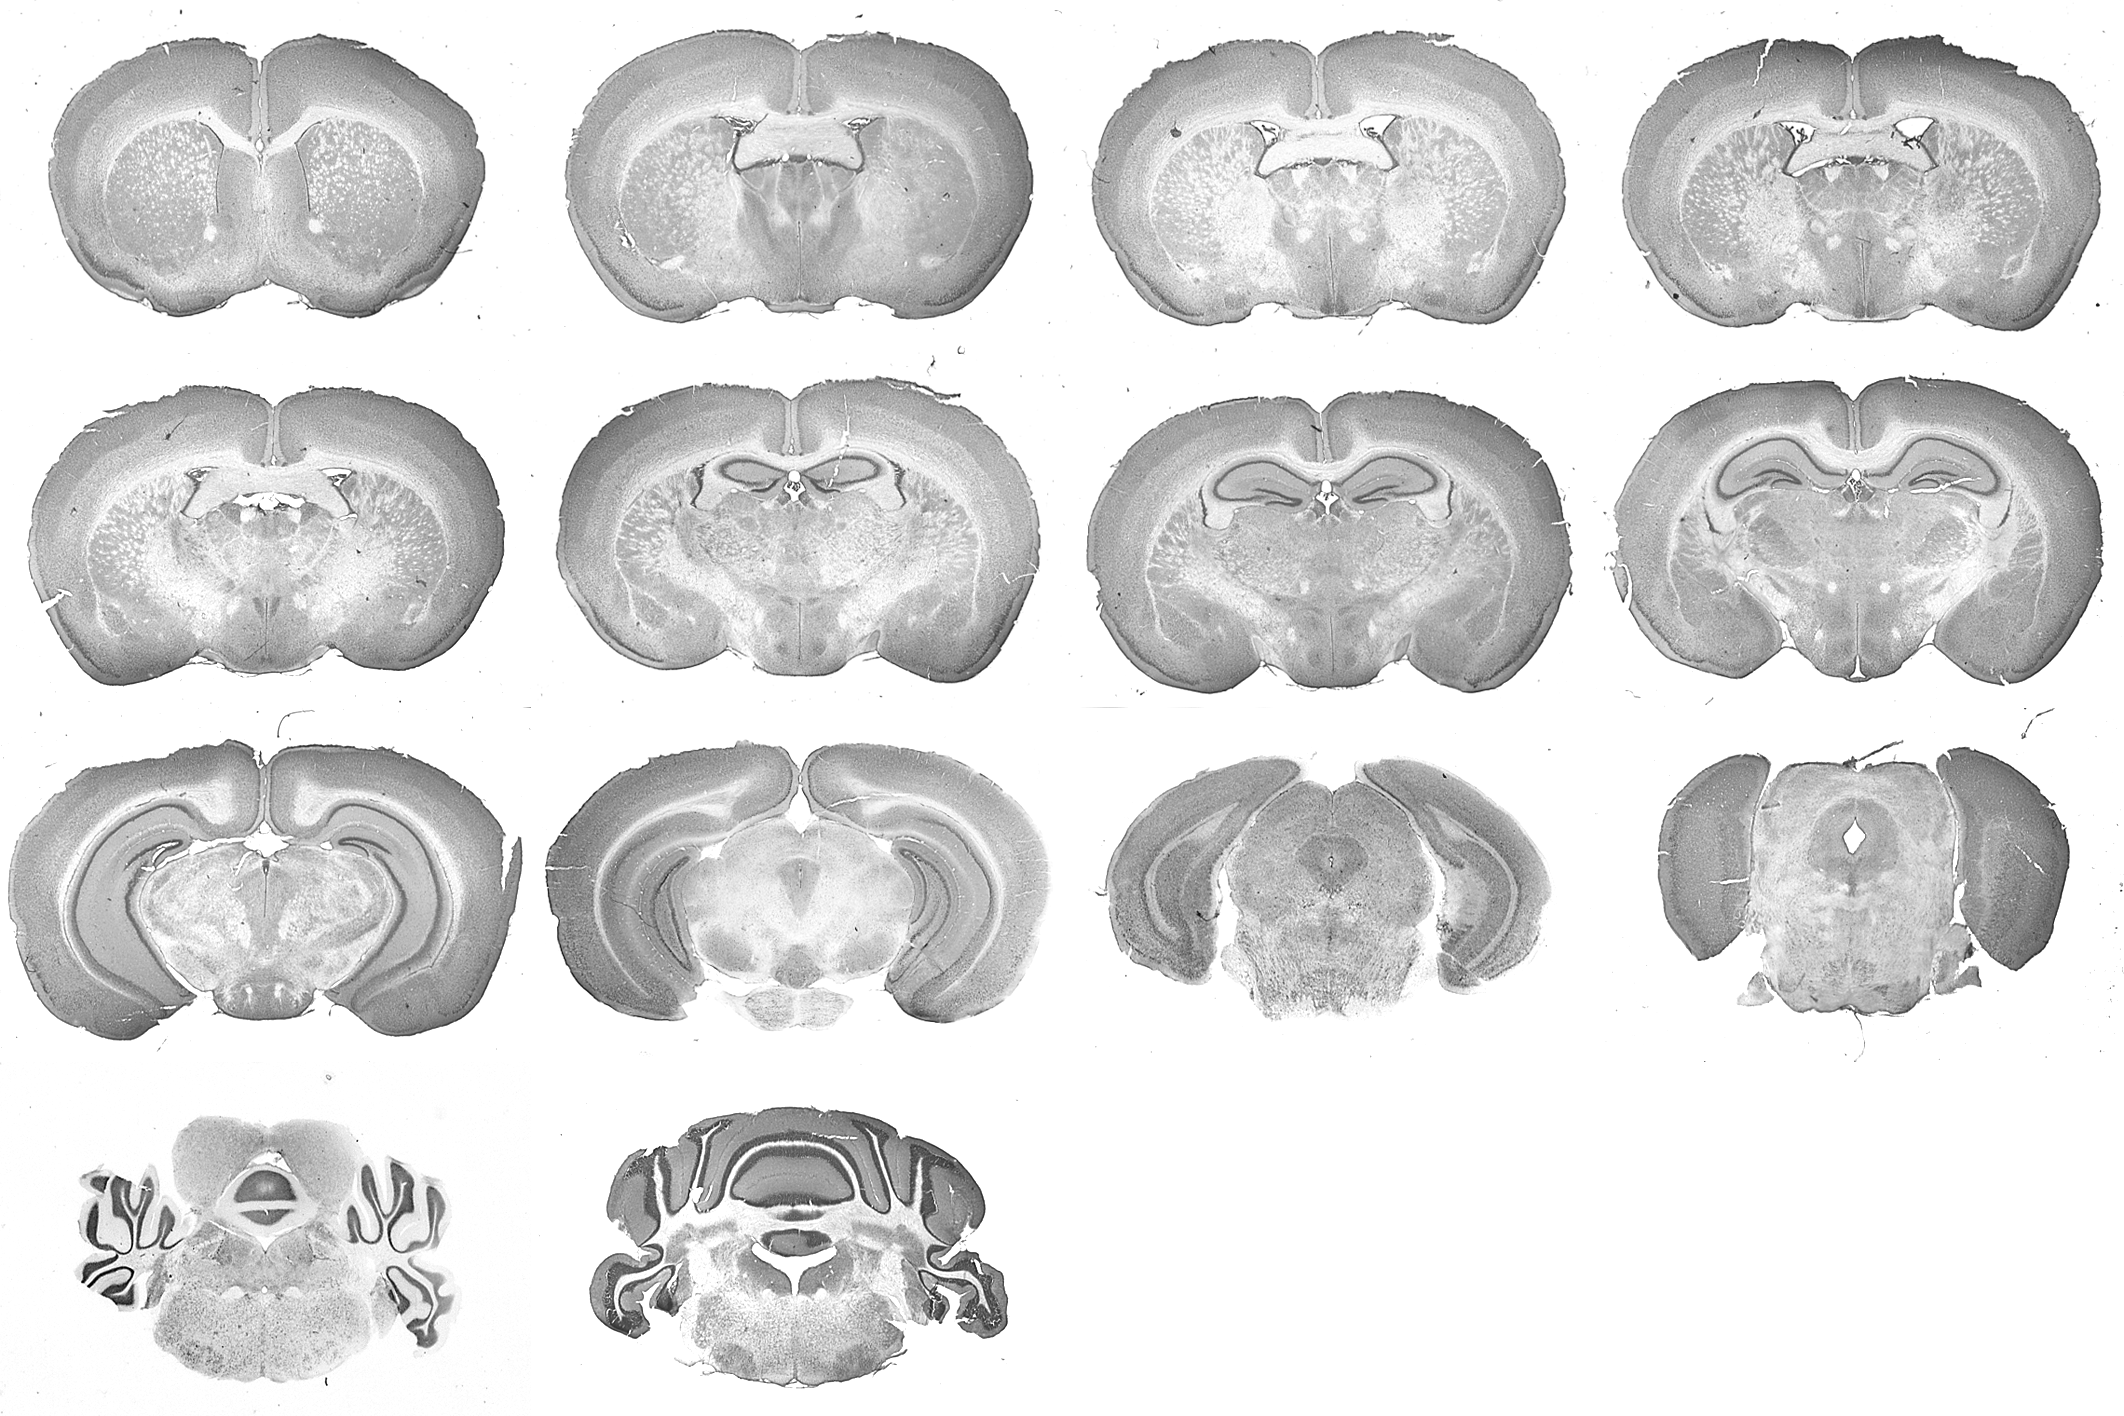
- Coronal section (PNG format)
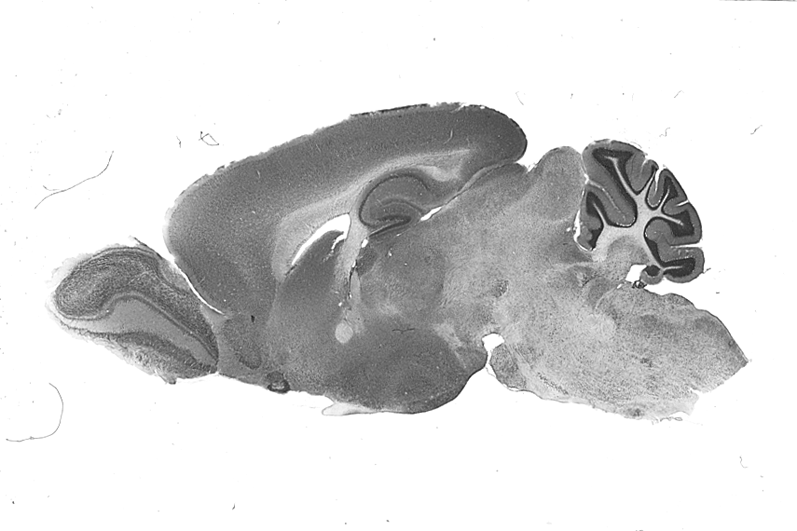
- Saggital section (PNG format)
Brain image files
These images were taken by Koh-hei Masumoto (Kinki University School of Medicine/RIKEN CDB)