BrainStars: 1418704_at: S100a13
| Affymetrix Probe set ID | 1418704_at |
|---|---|
| Gene Name | S100 calcium binding protein A13 |
| Gene Symbol | S100a13 |
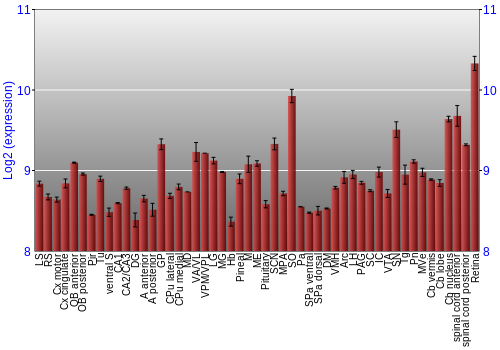
BrainStars Expression at 51 brain regions
PDF files:
Expression Graph,
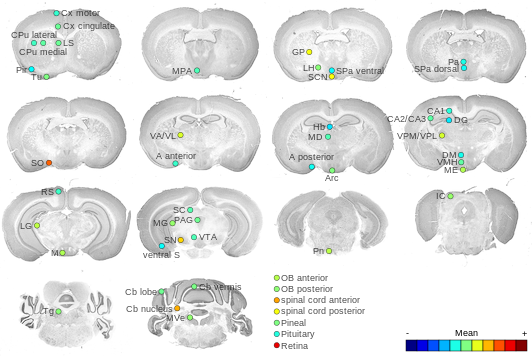
Expression Map
BrainStars classification of 48 brain regions by multi-state gene analysis
| # States | 1 |
|---|---|
| Score | -36.086134130754 |
PDF files:
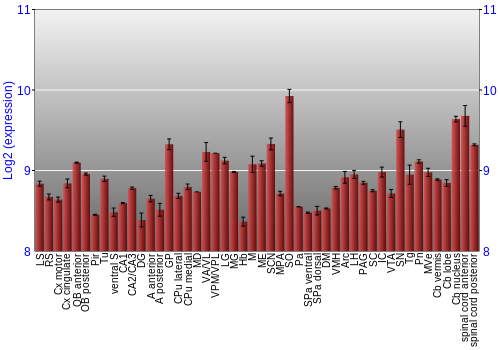
Expression Graph,
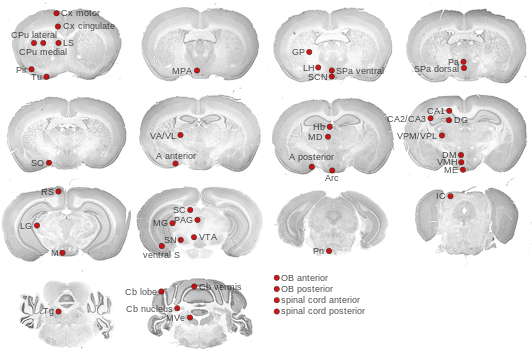
Expression Map
Other brain expression resources
Cross section images
The ViBrism cross section images (whole brain mode: beta version) were provided by the ViBrism team. A full 3-D model of the expression is available at their ViBrism site.
The ABA expression energy cross section images were obtained from the Allen Mouse Brain Atlas, Allen Instiute for Brain Science © 2008. Please refer to their original terms of use.
Links to other resources
BrainStars 1-D expression files
You can download BrainStars expression data in a table.| TSV format file | BrainStars expression in a tab-separated values format |
| CSV format file | BrainStars expression in a camma-separated values format |
BrainStars 3-D expression files
You can download this entry's BrainStars expression data putting on 3-D mouse brain models.| VCAT format file | BrainStars expression putting on a brain model. The file can be viewed with a software, VCAT, downloadable from VCAD@RIKEN site. |
| XPR format file | BrainStars expression putting on a Allen Reference Atlas brain model. You can view the XPR file with the Brain Explorer software provided by the Allen Institute. |
External links
| Entrez GeneID | 20196 |
|---|---|
| MGI ID | MGI:109581 |
| Ensembl | ENSMUSG00000042312 |
| UniGene ID | Mm.6523 |
| RefSeq Transcript | NM_009113 |
| RefSeq Protein | NP_033139 |
| Agilent ID | A_51_P269852 |
| Allen Brain Atlas | S100a13 |
| ViBrism | S100a13 |
| EMAGE | S100a13 |